Lending & housebuilding
The NRLA Data Observatory is a collection of official and other well-established data sources which when combined, provide a narrative of the Private Rented Sector (PRS). The NRLA tracks approximately 45 key data sets which are updated monthly, quarterly and annually. A selection of these appear in these pages.
Our Deep Insight blog provides a regular extension of the analysis which appears here, as well as those datasets which are not published in the Data Observatory section of this website.
The blog pages also features blog posts from other organisations and academics to provide insight on the PRS. Here you can also find more in-depth summaries of our regular reports and surveys.
Please note that covid-19 has affected the collection and publication of data, particularly data which is collected by local authorities. This means data is not as up to date as usual.
Bank lending
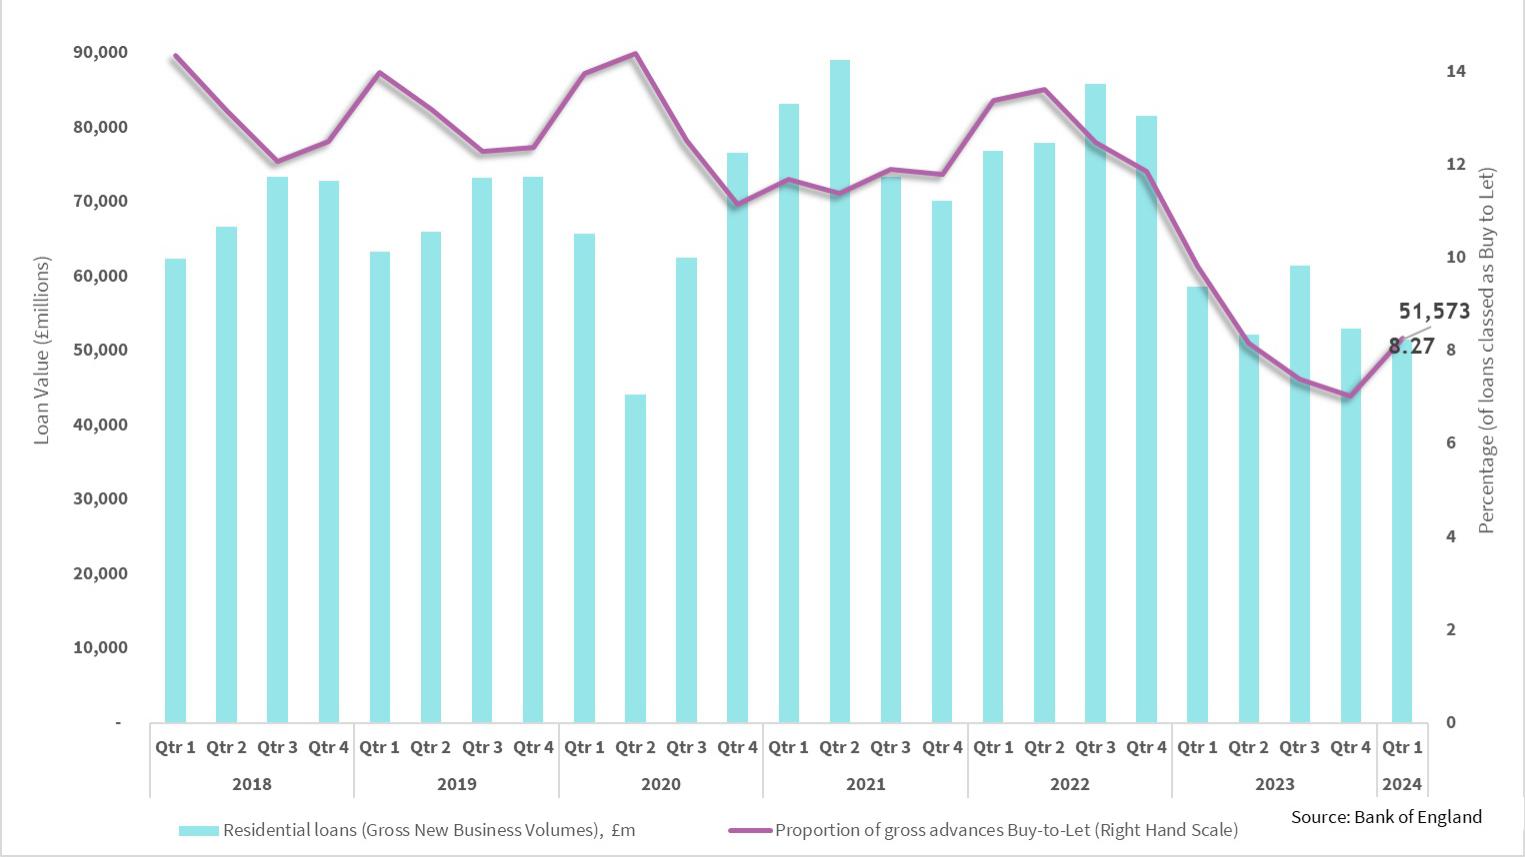
Chart 1: Residential & BTL (Buy-to-Let) lending activity
Residential loans (gross new business volumes) & buy-to-let lending activity, UK

Landlord borrowing as a percentage of total lending finally rose – albeit slightly – to account for 8.27% of residential loans to individuals. This is up from 7% in Quarter 4. Despite the rise, the proportion is still below the equivalent quarter of 2023 (which stood at 9.8%).
This rise marks the end of six consecutive quarters in which this share fell. Note however that while the slice of lending going to the BTL market rose, the size of the cake (total bank lending in this market) fell.
- In quarter 1 this year gross advances stood at £51,573m:
- Down over £1,370m on the previous quarter.
- Down over £5,700m on the same quarter in 2023.
This small increase in BTL lending should not be seen as a return of confidence among landlords.
Housebuilding - England
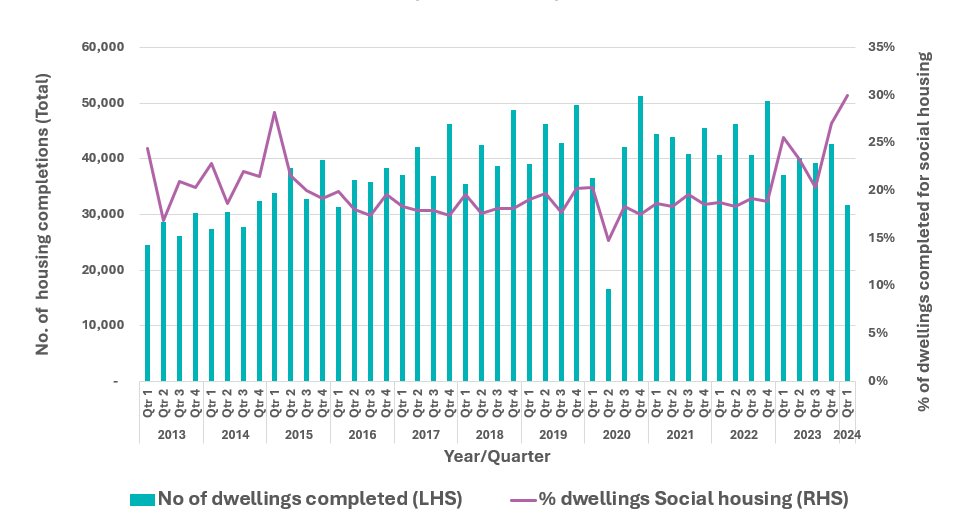
Chart 2: House completions - England
Permanent dwellings completed & proportion of dwellings completed as social housing
(England only)

In the first quarter of 2024, there were 31,670 housing completions in England.
- This marks a decline from the 42,710 completions in the previous quarter.
- Excluding the Covid years, this is the lowest number of completions in any Q1 period since 2016 (31,410).
Furthermore:
- Completions in this latest quarter are below both the five-year (39,592) and ten-year (36,318) averages for the first quarter.
Private dwellings
The number of private dwellings completed in Q1 was 22,190.
- This represents a 29% fall from 31,160 in the previous quarter.
- This figure is also the lowest in any single quarter (excluding Covid years) since Q3 2014.
Social dwellings
The social housing sector saw 9,490 dwellings completed in Q1.
- This is down from 11,560 in the previous quarter,
- The Q4 figure was however is the highest absolute number of social completions in any single quarter since Q1 1983 (12,270).
A closer look at the data reveals:
Housing association completions
- There were 8,400 housing association completions,
- This is a 22% fall from the 10,800 recorded in the previous quarter
- Despite this fall, it is only one of six quarters since Q1 1995 where housing association completions have surpassed the 8,000 mark.
Local authority completions
The number of local authority completions rose from 760 in Q4 2023 to 1,090 in this latest quarter
- This is a 30% increase on Q4 - albeit the numbers are small.
- This Q1 figure is the highest number of local authority completions in any single quarter since Q1 1992.
This quarter marks the first time since at least 2000 that social dwellings accounted for 30% of all dwellings completed. This high figure can be partly attributed to the lower-than-usual number of private completions.
- These fell by 29% compared to the previous quarter.
- For context, Q4 2023 saw 31,160 private dwellings completed. In Q1 2024, there were 31,670 total dwellings completed, of which 22,190 were private dwellings.
Housebuilding - Wales
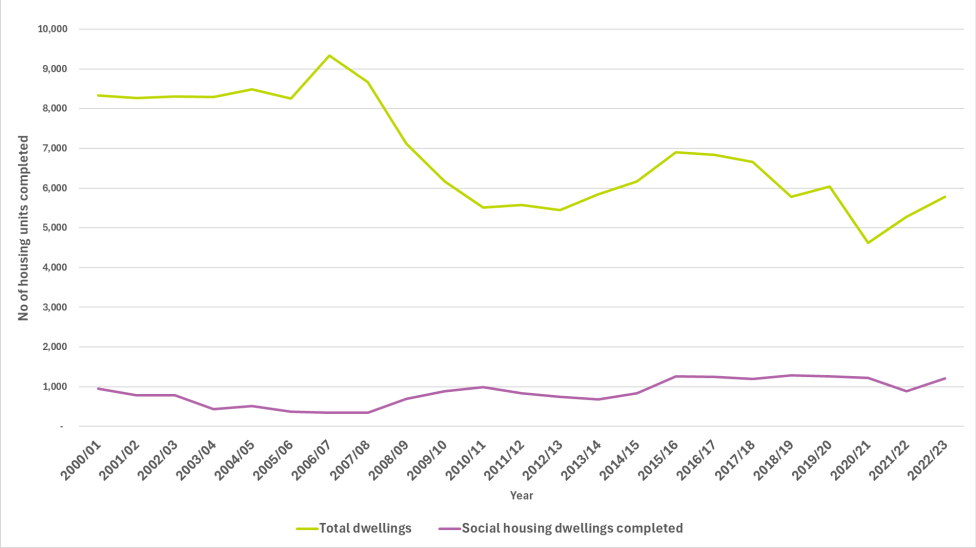
Chart 3: Housing completions in Wales (Annual data)
New dwellings completed in Wales: Total dwellings & social housing dwellings completed
(Annual)

After a long interval StatsWales has recently begun to publish housing completion statistics once more. Note that alongside the data is the following note:
"There is currently an undercount in the number of dwellings completed though this is estimated to be quite small."
This is a result of the counting methodology and is not Covid-19 related.
Total dwellings
In 2022/23, total dwelling completions rose to 5,785, marking a 9.7% increase from the 5,273 in the previous year.
-
It is also above the five-year average for total dwellings (5,498).
Social dwellings
Social housing completions remained stable in 2022/23 at 1,203, almost unchanged from the 1,215 completed in 2021/22.
-
However, the proportion of total completions accounted for by social housing increased to 20.8% in 2022/23, up from 16.7% in 2021/22.
Private dwellings
There were approximately 4,582 private dwellings completed in 2022/23. This is a slight increase compared to the 4,391 2021/22.
-
However, this is the highest number of private completions since 2019/20 (4,773).
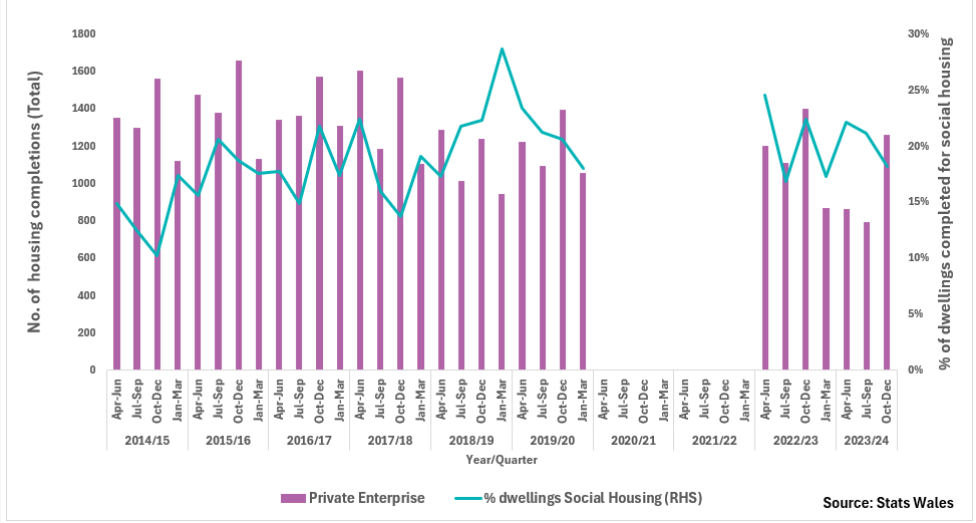
Chart 4: Housing completions in Wales (Quarterly data)
Permanent dwellings completed & proportion of dwellings completed as social housing
(Wales)

The third quarter of 2023/24 (Oct-Dec) saw a total of 1,539 housing completions in Wales.
- This is an increase of 53% from the previous quarter (Jul-Sep) - which had 1,005 completions.
- However, it represents decrease of 14.5% compared to the same quarter in the previous year (2022/23), which recorded 1,805 dwelling completions.
The cumulative number of completions in the three quarters of 2023 presently stands at 3,652.
- This indicates a modest recovery in the housing industry from the lower-than-average numbers recorded in Q1 (1,108) and Q2 (1050) in 2023.
However, these figures are 22.9% lower than the combined total for the same period in the previous year (2022), when 4,735 dwellings were completed.
- These latest fugures are the lowest total number of dwellings completed in these three quarters since data collection began in 1974.*
*Note that the total for 2023-24 is the lowest for these quarters, not including the years affected by COVID-19 (2020-21 and 2021-22).
(There is a gap in data collection due to Covid-19)
