
English Housing Survey: strains on the PRS pre-date Covid-19
Introduction
The ministry responsible for housing – the MHCLG – recently published the latest edition of the English Housing Survey (EHS).
This post looks at some of the key data which emerges from the Headline Report and the implications for the Private Rented Sector (PRS).
This is a report based on survey data collected by MHCLG. The fieldwork for the 2019-20 report concluded in March 2020 and so reflects the Private Rented Sector (PRS) immediately before the Covid-19 pandemic.
The importance of the PRS
The EHS estimates there are now approximately 4,438,000 households who are in the Private Rented Sector. This is a fall from last year (4,552,000) of around 114,000 households. It is the first time since 2014-15 that the estimate has fallen below 4.5m households. It is the third consecutive year the numbers of households in the PRS have fallen. The number of households in the PRS is now 250,000 below the peak in 2016-17 (4,692,000).
The first graph below shows that the overall proportion of households who reside in the Private Rented Sector (PRS) has fallen to just under 19% (18.7%) of all households.
Graph 1: Total households in England & proportion in the PRS
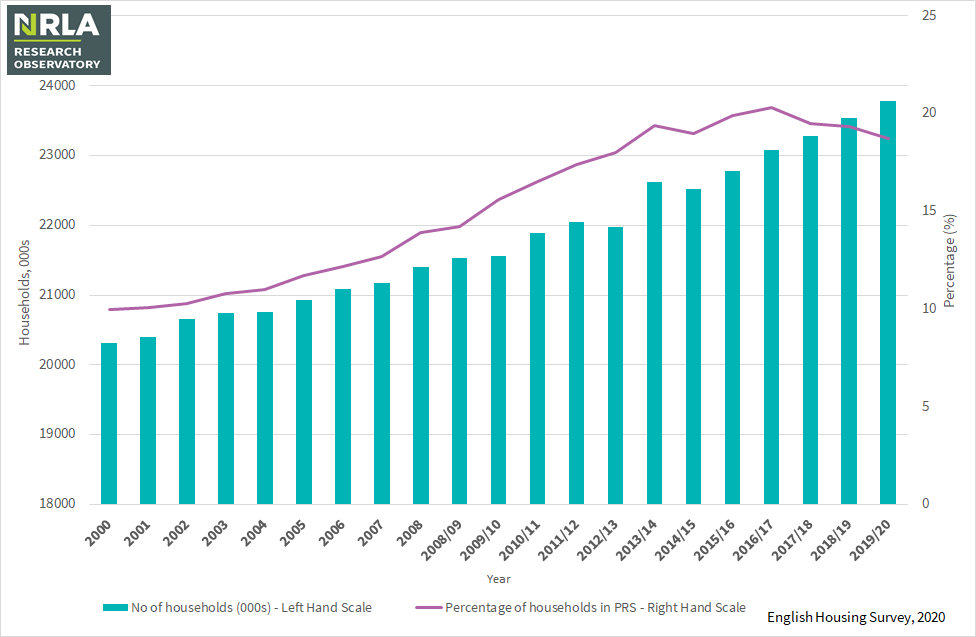
The key point however is that the proportion of households in the PRS remains well in excess of the 10% recorded in the year 2000.
It would be unwise at this moment to draw a conclusion that the proportion of households living in the private rented sector is clearly falling. But, after a period of rapid growth, the rented sector does now seem to have found a new level within the housing mix for England.
The graph below shows the pattern of PRS-tenured households across the English Regions:
Graph 2: Households in the PRS 2018/19 & 2019/20 by region
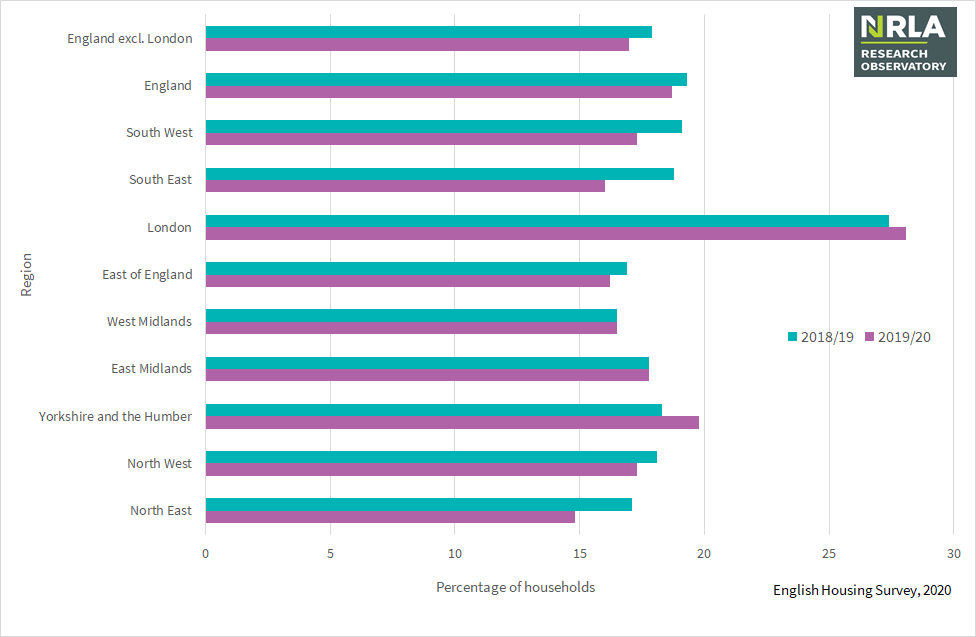
Across England as a whole the fall in the PRS is slight when measured as a percentage of total households. However, only in two regions - London and Yorkshire and the Humber – have the proportion of households in the PRS increased since 2018/19. In every other region the proportion of households in the PRS has either fallen, or, in the case of both Midlands regions, remained the same.
The fall has been most marked in the South East where the proportion of households in the PRS has fallen from 18.8% to 16% in just twelve months.
Rent levels
The survey has also reported on rent levels. Unlike the Family Resources Survey (which is also used in the Observatory pages of our blog), there is no regional analysis of rents other than for London. It is worth a reminder that the fieldwork for this report concluded prior to the Covid-19 pandemic.
However, these figures show that, even before the pandemic, these were already tough times for landlords:
Graph 3: Average (median) weekly rents for London and rest of England, 2018/19 & 2019/20
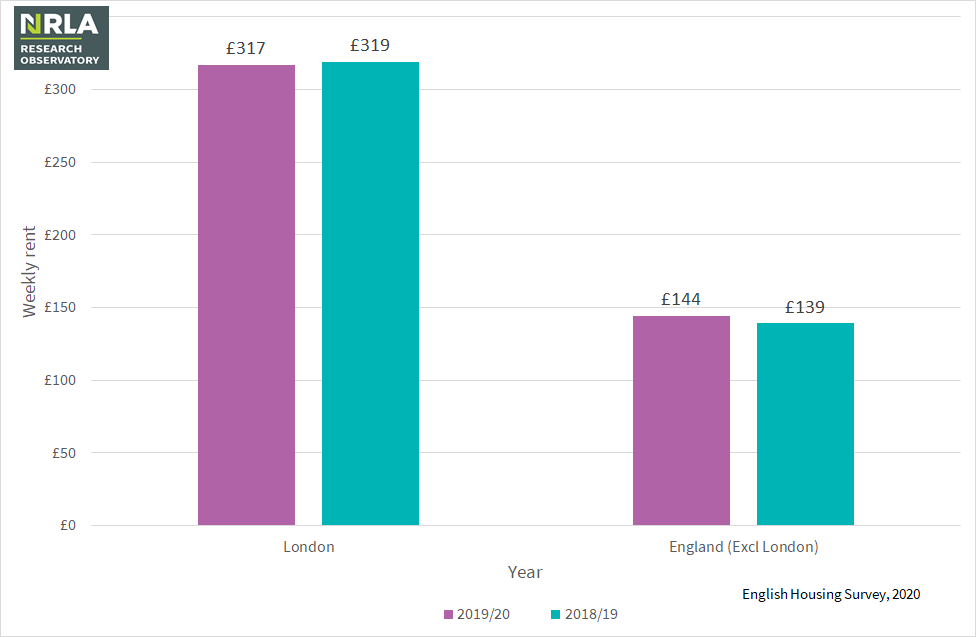
In London, median rents fell in money terms - by £2 per week. This equates to a -0.6% fall in money terms, but this reduction is even greater once inflation is factored in. Note that, though not charted here mean (as oposed to median) rents rose - from £341 to £342 per week
Outside of London however, median rents did at least show an increase. The increase in median rents to £144 from £139 per week is equivalent to a 3.6% increase. Although it will depend on how and when this survey based figure is calculated, we can say that rent increases outside London have been just above other measures of inflation.
However outside the capital mean rents fell - from £162 to £159. So whilst outside the capital median rents rose and mean rents fell, in London the opposite occcured (median rents fell and mean rents rose, albeit only slightly).
(The CPI for example grew 2.07% during 2019 and 0.9% during 2020 (based on changes in the index measure - our own calculation)).
Landlord investment
Despite the fall in rent levels (for many even before adjusting for inflation) many landlords are experiencing , the English Housing Survey captures the large amount of investment being made in the sector.
Take landlord investment in energy efficiency for example. Even though the EHS shows the type and age of dwelling stock in the PRS has not altered that much, the prevalence of energy efficient housing certainly has.
The graph below shows the proportion of houses in the PRS which have an EPC rating of “C” or higher. Note that although the report is dated 2019-2020, this particular data is labelled 2019 and uses calendar years.
The 2007 level is the earliest date for which the NRLA presently holds data on its Observatory database:
Graph 4: Proportion of dwellings with an EPC of “C” or better, various years
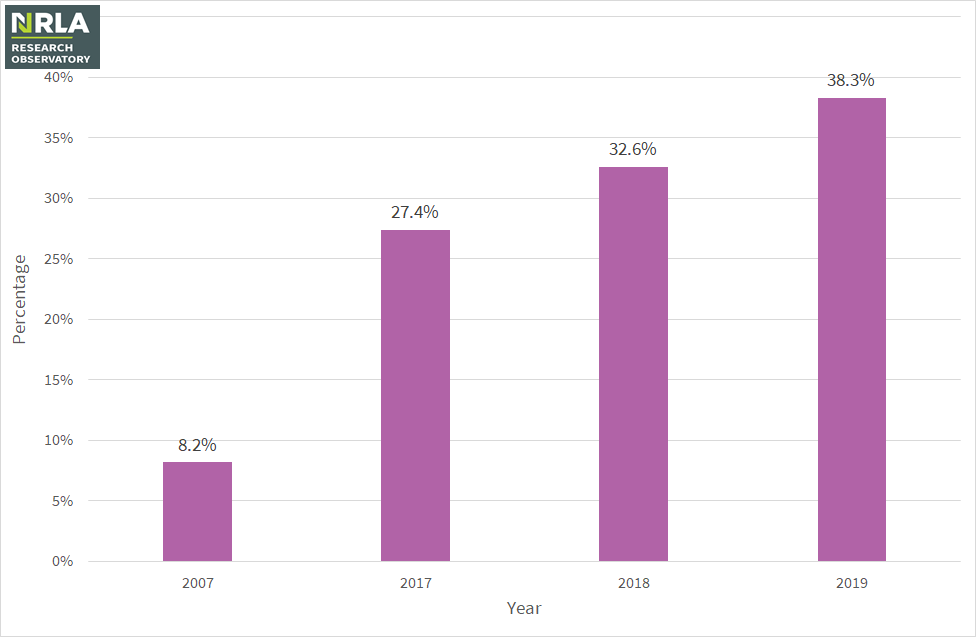
Since 2007 the proportion of homes in the PRS achieving the highest EPC levels has risen almost five-fold. It is also continuing to rise. This rise cannot be simply attributed to a changing housing stock profile. Instead, landlords have been responding to market demand, tenant requests and their own concerns for the environment.
This investment is now being made at a time when there has been little rental growth, nor is future rental growth likely to be significant. Yet at the same time, landlords are being asked to make significant investments in their properties for reasons other than the prospect of being able to charge market rent premiums.
The evidence here underlines how important incentives such as the Green Homes Grant could be to keep this momentum going.
Summary
While our member surveys have, for some time, consistently showed more landlords looking to sell than buy due to tax changes and increased regulation, many stakeholders in the PRS have dismissed such figures as 'empty threats'.
"But we are now seeing, from independent statistics, both the numbers of PRS dwellings and their proportion of tenure share falling, it seems landlords are following through on their intention to exit the sector.
"With further pressure to come from the Renters' Reform Bill, possible Capital Gains Tax increases and full implementation of mortgage interest relief restrictions, and the possession action curtailed by emergency Covid regulations, the Government needs to restore confidence if it is to avoid acceleration of this process, and the subsequent crisis in the supply of rented homes.
For the third consecutive year the number and the proportion of households living in the PRS has fallen from its all-time highs. This does not mean a decline in the sector, it shows a consolidation following almost two decades of rapid growth. That said there are now 250,000 fewer households in the PRS than there were in 2015-16.
The EHS captures in a large scale annual piece of research what the NRLA - and its two founding partners - have been saying for some time: Landlords are responding to increased regulation at a time when rent levels are stagnating (and often falling in real terms). The fear is the response of landlords in many instances will be to leave the market and reduce housing supply in the rental market.
Note that much of the data collected for this study was before the Covid-19 pandemic. In order to maintain a supply of rented accomodation (the EHS shows that households in social housing has remianed more or less flat) government need to recognise (i) the difficulties presented by the rental market at present (ii) not all of these problems are a product of Covid-19.