This news article is more than 12 months old and some of the information may be out of date - please see our latest news articles here.
Landlord Confidence Index (LCI) No.6: 2020 Q2
Our Landlords’ Confidence Index (LCI) aims to provide a snapshot of landlord confidence.
The LCI attempts to capture the motivations underpinning landlords’ key business decisons.
It is being produced at a time when landlords face pressure from government: tax changes, new regulations and the threat of adverse legal reforms are now threatening the supply of homes in the Private Rented Sector (PRS).
Page 1
Page 1 - commentary
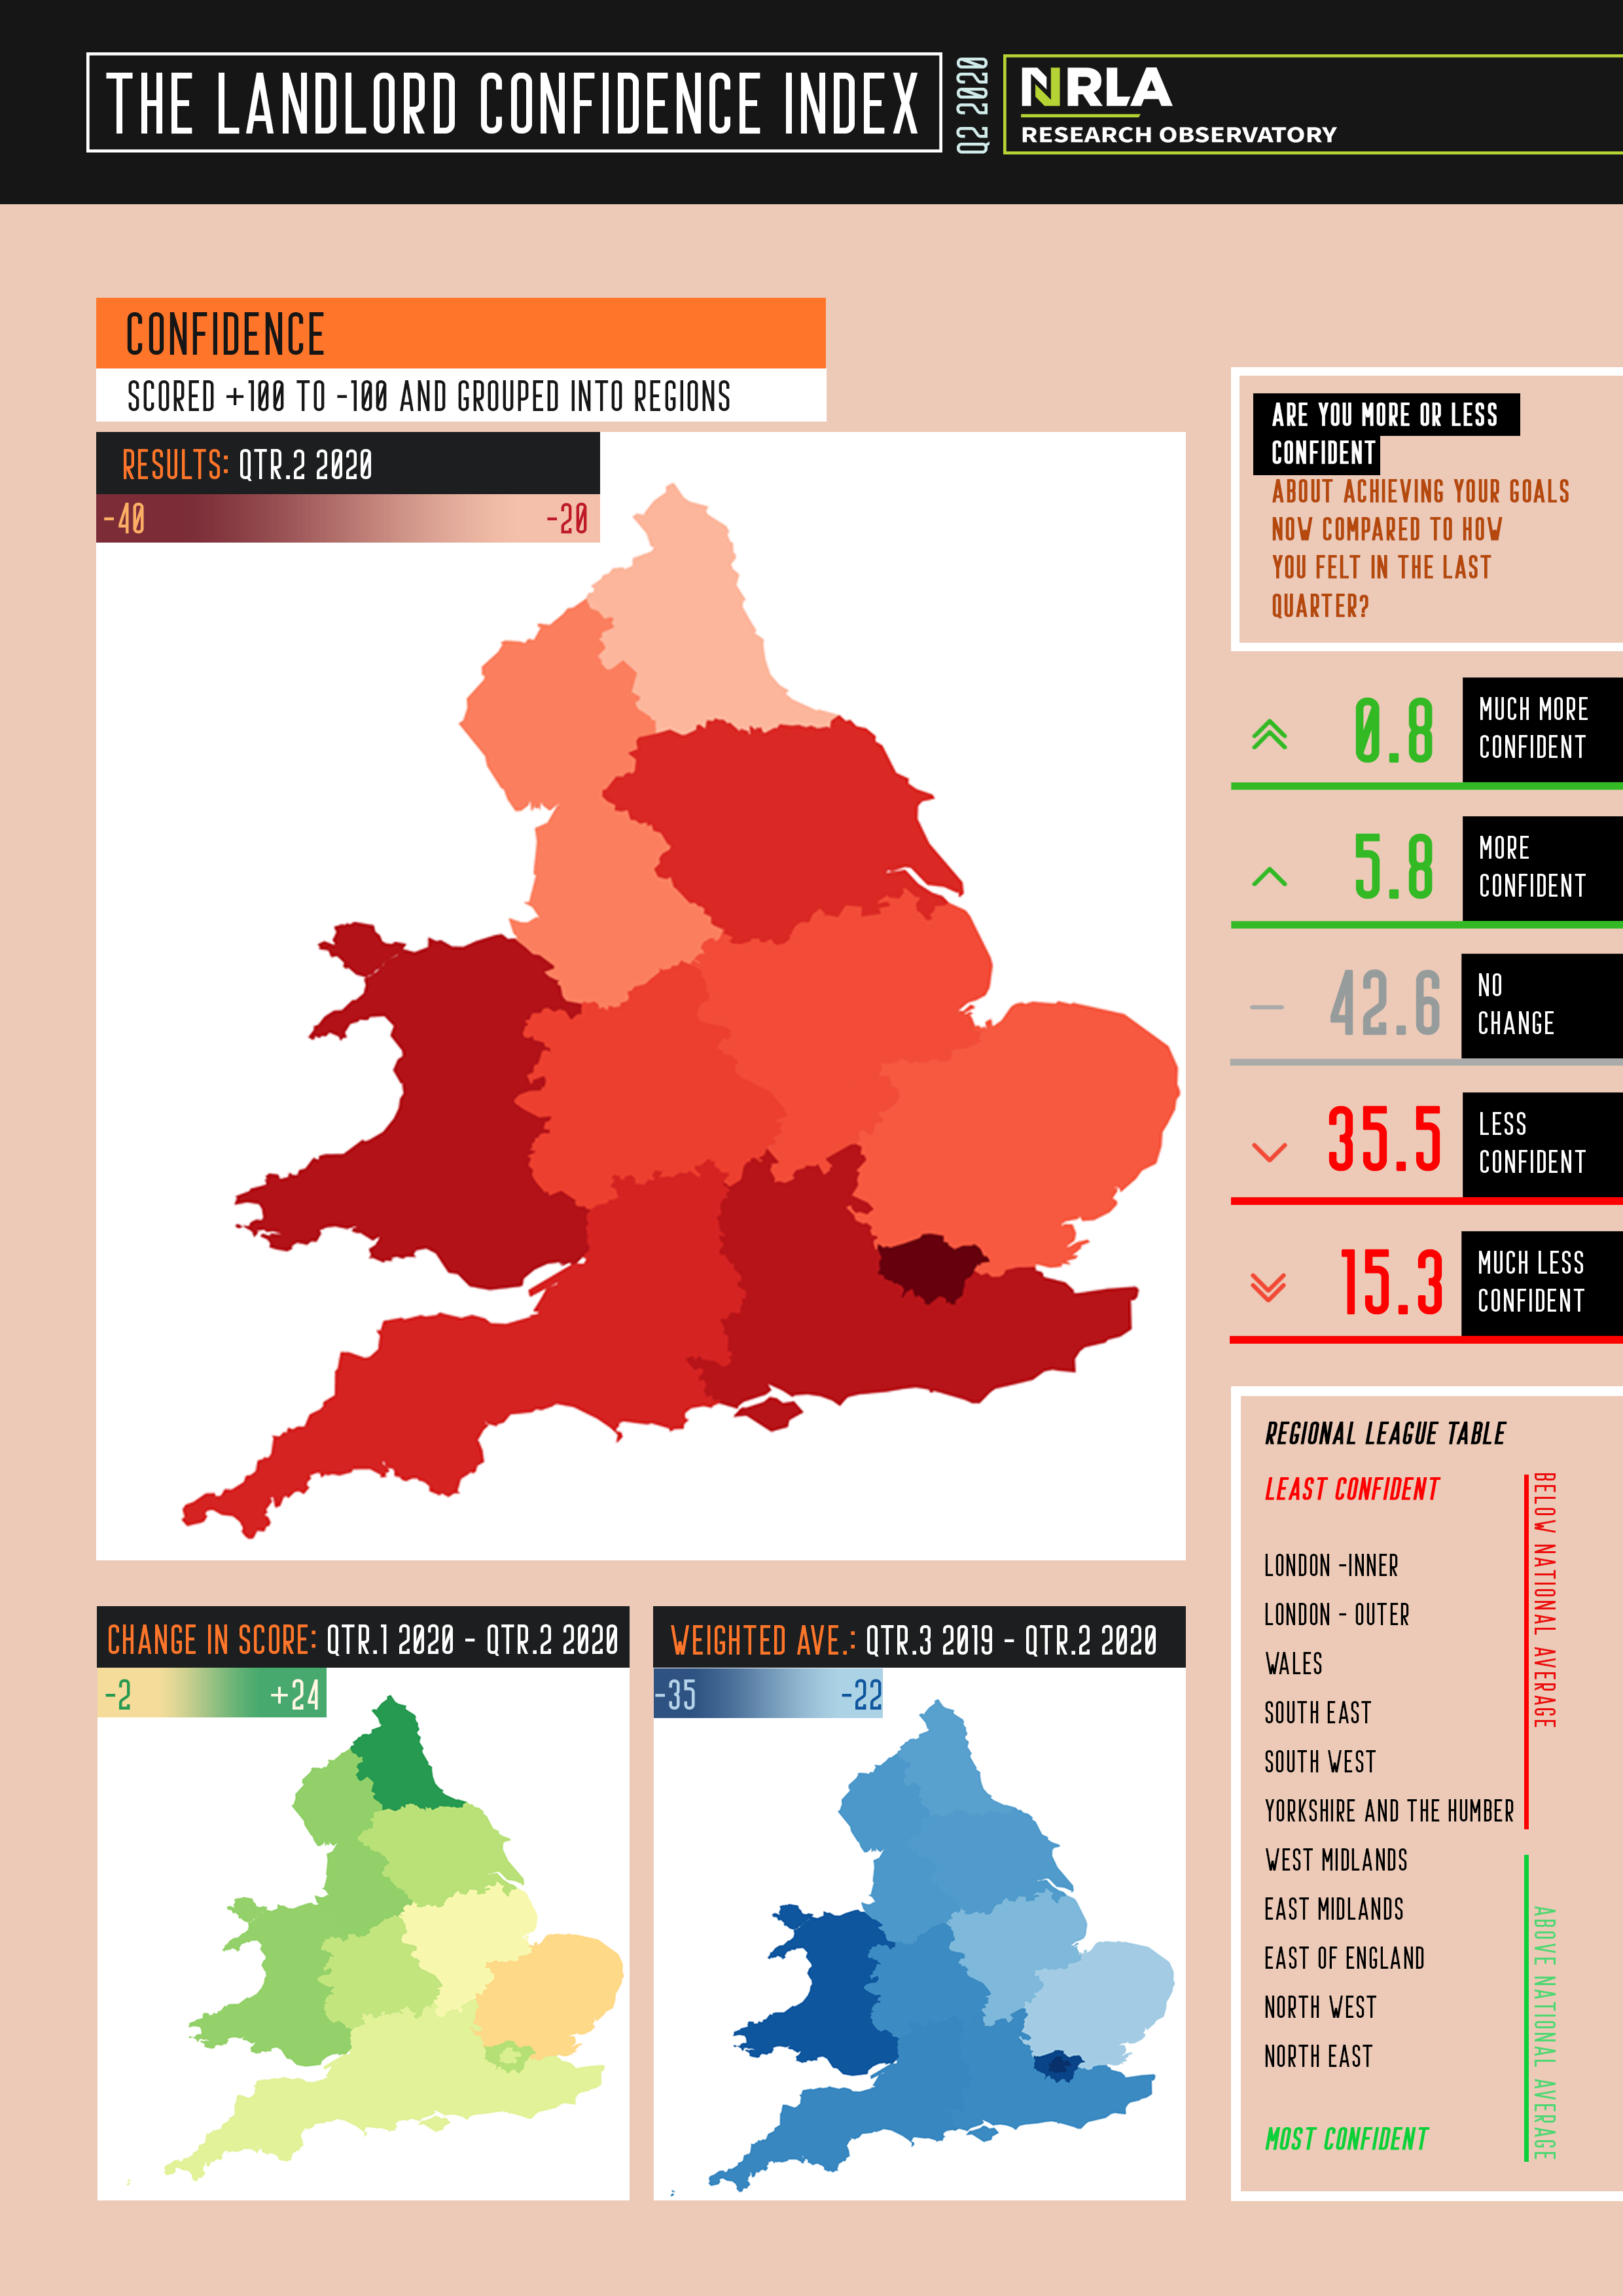
Main chart
Quarter 2 shows landlords continue to be anxious about their business future in the sector. The deeper the red shading, the lower the level of confidence.
Landlords with portfolios focused in both Inner and Outer London, as well as in Wales are those least confident about their futures when compared to twelve months ago.
It is landlords with portfolios in the North East and North West – where confidence is highest. However, even in these regions, confidence is clearly in negative territory.
Change in confidence
At least there is some good news when comparing Quarter 2 to the low scores experienced in Quarter 1. Most regions improved their score compared to the Quarter 1 survey - this was undertaken just as lockdown was starting.
The only significant decrease in confidence was in the South West. This may be a lagged effect - the fall in confidence in Quarter 1 was not as great in this region as many others. Note that the South West is the region in which rents have seen the greatest level of increase.
The final chart – predominantly blue - shows the average score across the last four quarters with a weighting applied. London again is the lowest scoring region. Even though confidence in Wales notably picked up in Quarter 2 it remains one of the lowest scoring regions.
Page 2
Page 2 - commentary
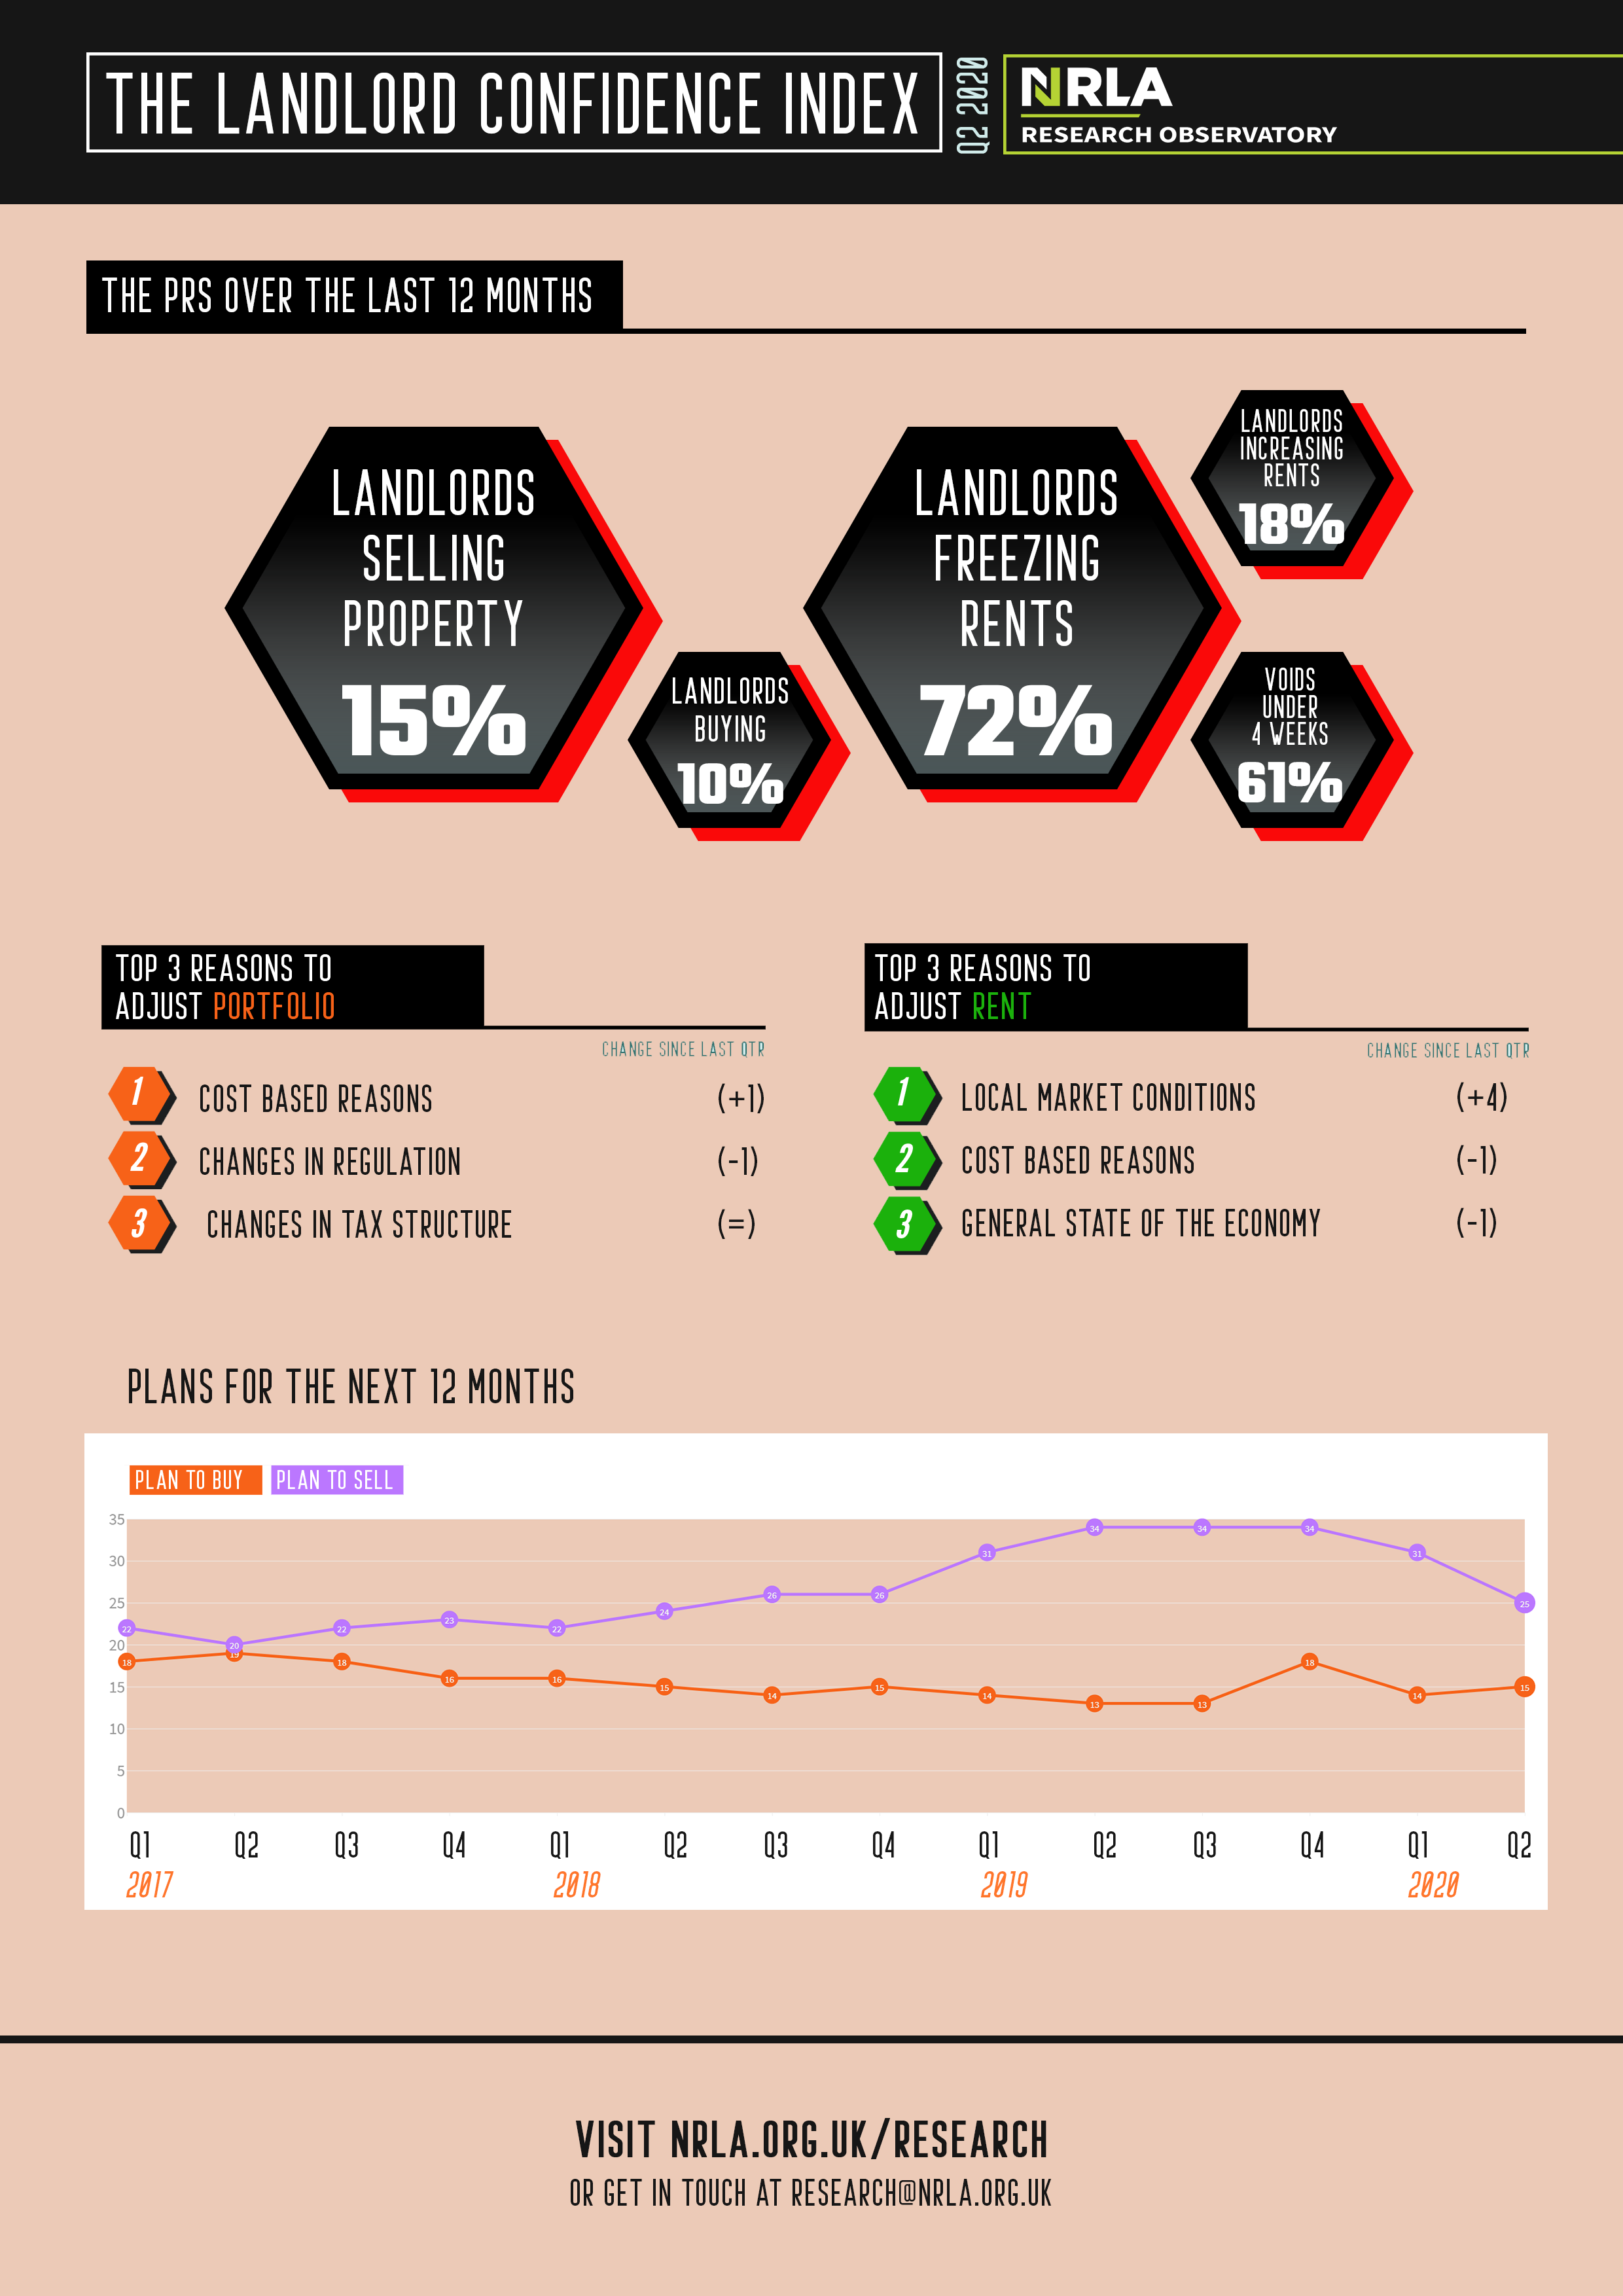
Decisions over the previous twelve months
The first set of data shows some key statistics from the Quarter 2 landlord survey on landlord decision making over the last twelve months.
These data show:
- Slight reductions in the proportion of landlords either buying or selling in the last twelve months – which may reflect a “wait and see” approach.
- Almost three quarters of landlords freezing rents over the last twelve months with fewer than one-landlord-in-five raising rents.
- Demand for property in the PRS is such that over 60% of vacant properties are taken up within a four-week period. This is a similar level to previous quarterly surveys.
The reasons for the rent decisions taken by landlords are a function of local market conditions and the general state of the economy – this makes landlords feel they are unable to raise rents. They fear losing good tenants.
For those landlords making adjustments to their holdings, these differ based on how regulation and taxation (among other factors) have an impact on individual business models.
The next twelve months
The final graph shows the proportion of landlords who plan to either buy or sell over the next twelve months.
The gap between the two has fallen markedly since last summer. This could purely be a covid-effect. It could also indicate that the pain inflicted by tax changes and new regulations – plus future changes in the pipeline – are now more fully baked into landlords' plans.
The figures may then indicate the PRS is now at a point in which that rebalancing could now be complete - or at least paused while the effects of the pandemic on the PRS become more clear.